

Key Metrics:
0.74x net cash
0.50x NCAV
7.7x earnings
Buying back shares
Anytime you find a profitable, US-based business trading below net cash, you should stop everything and take a closer look.
Because that kind of valuation does not exist in private markets.
That is something you only get in public markets when something is either extremely overlooked or extremely out of favor.
With this business, it is the first one.
The business is extremly overlooked.
There are no writeups on this anywhere.
Not on Substack, not on Seeking Alpha, not on Value Investors Club. Nowhere.
The business itself is not exciting. It does not make anything you would read about in the news, and it has nothing to do with any hot trend.
But the valuation is exciting.
And that is enough for me.
It trades at 50% of NCAV and even below net cash.
26% below net cash, to be precise.
The business has no debt and management is buying back shares, which is probably the best use of capital at a valuation like this.
And it is profitable, trading at 7.7x earnings.
At this price, every share of inventory, every customer relationship, every piece of equipment, and every dollar of future earnings is being handed to you for free.
Actually, better than free. You are effectively being paid to take it.
Let’s take a closer look.
Angstrom Technologies, Inc.
Ticker: AGTT Market Cap: $2,031,807
Here is the one-line version: Angstrom makes fluorescent chemicals.
These go into things like inks, varnishes, toners, paints, and adhesives. The company also makes some of those finished products itself, like inks and toners.
On top of that, they make patented fluorescent detectors. These can identify or authenticate materials using light. Think security printing, things like banknotes or packaging with hidden fluorescent markers, industrial quality control, and specialty coatings.
The company is based in Florence, Kentucky and has been around since 1983.
Revenue breaks down into three buckets:

Chemicals are the core at 71.6%. Toners and inks are second at 26%. And hardware, meaning the detectors, is a small but steady contributor at 2.4%.
The Dark Years
Before we look at the numbers, there is one thing you need to understand about this company.
For a stretch of time before 2022, Angstrom was a non-reporting or “dark” company. Meaning it filed no public financial disclosures for an extended period.
During this time, the stock price collapsed to near zero, as there was no public financial information for investors to evaluate the company’s value or health.
Then, on January 14, 2022, the lights came back on. Angstrom filed its first reports in several years, publishing its annual reports for FY2019 and FY2020 retroactively.
The stock began to recover as investors processed the news that the business was still alive and generating cash.
Since then, the company has filed annual reports for each fiscal year through FY2025 (with the FY2025 report issued in February 2026), demonstrating a consistent commitment to ongoing disclosure.
But consistent does not mean communicative. Shareholder communication is basically nonexistent beyond the bare minimum required. They don’t provide an outlook or commentary in the annual reports.
They do publish short quarterly financial summaries, just the numbers with nothing attached, but those only go back to when they started filing again in 2022. Nothing retroactive for the years before that.
I also could not find any annual reports predating 2018. I do not know where they were filing before, but I doubt it was with the SEC because there is nothing in the archives.
That makes it genuinely hard to say how long the dark period actually lasted. My best guess is it was not longer than a year, because the stock did not stay at rock bottom for very long. But I cannot say that with confidence because the records simply are not there.
The one thing I did find was through the Internet Archive.
Their website shows regular news updates going back to at least 2013.
You can see a snapshot from 2017 here:
https://web.archive.org/web/20170703151659/http://angtech.com/News.aspx
However, even that doesn’t tell you much, as they don’t disclose any new figures.
I want to be upfront about one thing. The absence of earlier reports made this analysis harder than it should have been, especially on the income statement side. The balance sheet is very attractive and straightforward. But there have been some meaningful developments on the income statement over the years, and I would have liked to put those in context with older filings.
The Balance Sheet
The balance sheet is the most attractive part of the Angstrom story.
As of October 31, 2025, it looks like this:
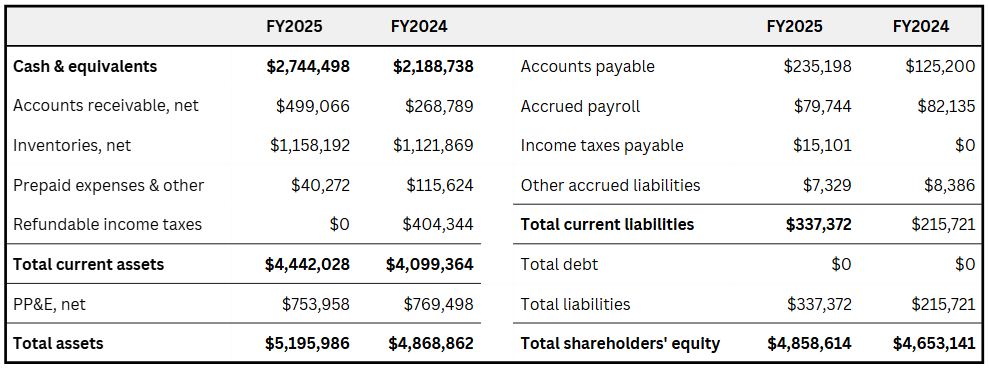
There is no debt at all. The company has no bank loans, no bonds, and no convertible notes.
The $337K in liabilities are entirely operational, just payables and accruals.
Cash alone is $2.74 million. The entire market cap is $2.03 million.
Even if you subtract the $337K in liabilities, which again are not financial debt, the stock still trades below net cash.
Conservative net cash: $2,744,498 − $337,372 = $2,407,126
Against a market cap of $2,031,807.
Total current assets come in at $4,442,028.
Subtract the liabilities and you get an NCAV of $4,104,656.
So the stock trades at 0.50x NCAV.
Let that sink in.
Now, I think management knows exactly what the stock is worth. Because they have been buying it back:
FY2023: $50 in treasury stock purchases
FY2024: $27,555 in treasury stock purchases
FY2025: $58,360 in treasury stock purchases
While the dollar amounts are small in absolute terms, the pace is accelerating. As a percentage of market cap, $58K represents about 2.9% of the entire company being retired in a year.
When a company trades below its own cash balance, buying back stock is about the most rational thing management can do.
The Income Statement
This is where it gets complicated.
The table below shows the full income statement summary from 2018 through 2025. That is everything available. You need this long view to understand what has been going on with the business.
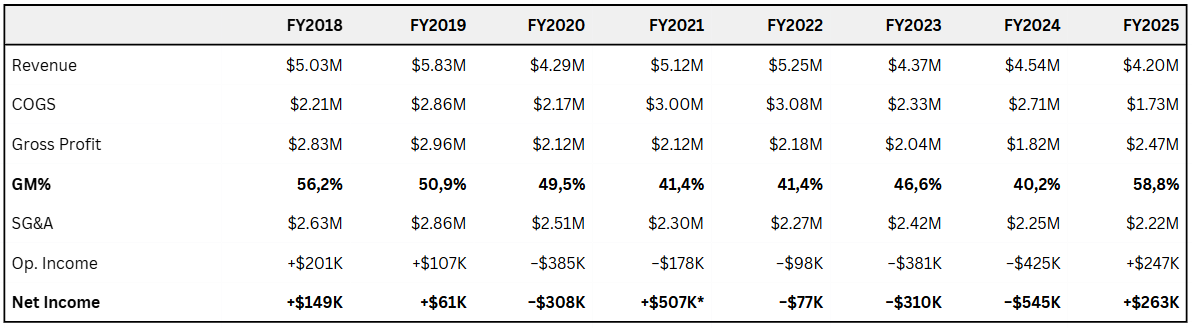
From FY2021 through FY2024, the company reported operating losses every single year.
FY2021 looks like an exception at first glance, with net income of $507K. But strip out $446K in PPP loan forgiveness and $235K in CARES Act Employee Retention Credits, and that year is a loss too.
FY2025 is the first genuinely profitable year since 2018 and 2019.
And the stock trades at 7.7x those earnings. Given the cash position and the discount to NCAV, that is cheap.
But the obvious question is whether the profitability is real and whether it will last.
That is the main question here. And I will be honest, I do not have a clean answer. I have a theory, and I will walk through how I got there. But parts of this are speculation, and some management commentary would go a long way toward filling in the gaps.
That said, the absence of that commentary is probably part of why the opportunity exists at all.
Here is what I think happened:
The Margin Mystery
The key to understanding everything here is the gross margin.
Before COVID, gross margins were above 50%. In FY2018 they came in at 56.2%. FY2025 shows 58.8%, almost exactly the same level.
Something happened in between that made margins significantly worse for five straight years. The worst was FY2024 at 40.2%. Those weaker margins worked their way straight through the income statement and into the losses you see above.
When I first looked at this, I thought it was an inventory problem.
Back in 2018 and 2019, Angstrom was sitting on over $3 million in inventory. My initial theory was that old, expensive inventory was working its way through the income statement, and under FIFO accounting, that high-cost material was keeping margins depressed for years afterward.
But I dropped that idea.
It didn’t really make sense from an accounting perspective for several reasons.
So I went looking for another explanation.
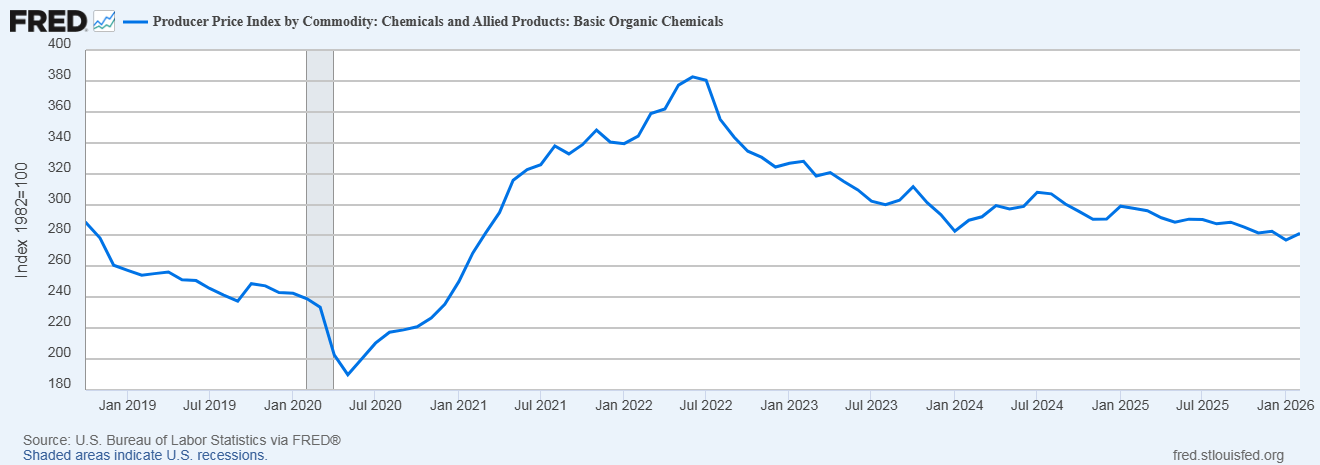
I looked at price indices as proxies for what was happening on both sides of Angstrom’s business. What they pay for inputs, and what they can charge for outputs.
For input costs, I used two PPI series. The Basic Organic Chemicals index (WPU0614) and the Cyclic Intermediate Chemicals and Dyes index (WPU061402). These track the kind of chemical intermediates that go into fluorescent dyes and pigments, which is likely what Angstrom is buying:
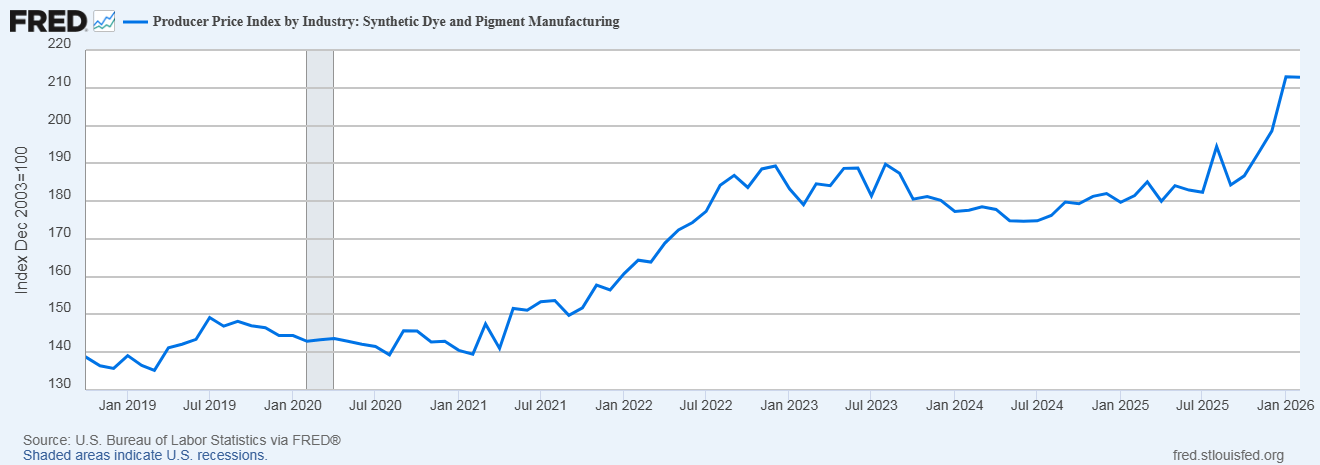
For output prices, I used the PPI for Synthetic Dye and Pigment Manufacturing (PCU3251332513). This tracks what manufacturers in this space charge for finished products, which gives a rough proxy for what Angstrom can charge:
When I put these together, the margin picture started to make sense.
During COVID and the years that followed, input prices rose faster than output prices. You can see the sharp rise in the Basic Organic Chemicals index while the output index climbed more slowly.
The spread between what Angstrom likely paid and what it could charge got squeezed. That matches exactly what we see in the financials from FY2020 through FY2024.
Then the dynamic shifted.
Input prices came off their peak. The output price index held steady and has actually been rising. The spread widened again, and that is what shows up in the FY2025 margins.
The way FY2025 reads to me is this: Revenue has fallen from $5.25 million in FY2022 to $4.2 million in FY2025. But gross margins have improved significantly. Inventory is down from over $3 million in 2019 to $1.18 million today. It looks like Angstrom is selling less volume but at higher unit prices, with input costs that have not kept pace with what they can charge. That is what the output index implies, and it is what the margins show.
The open question is whether the current near-60% margin is close to Angstrom’s normal, or whether it is a coincidence that it happens to land near the 2018 level. Older reports would have helped answer that.
It is also interesting to see how the index prices have performed since the end of FY2025.
FY2026 started in November 2025. Since then, the Basic Organic Chemicals index has continued to decline, from 285.4 to 281.4. And the Synthetic Dye and Pigment Manufacturing index has risen sharply, from 186.7 to 212.8. That is another 14% move in the output direction.
So the spread has widened further. If the pattern holds, margins may have improved again in FY2026.
The honest caveat is that I am working with public indices as proxies. I do not have visibility into Angstrom’s actual contract prices or what they pay their suppliers. And the company tells us nothing.
But the pattern is consistent. And the valuation leaves room for a lot to go wrong.
Speaking of valuation:
Valuation
Let’s keep this simple.
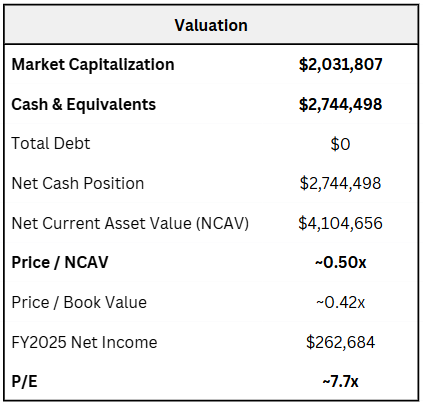
The stock has a negative enterprise value. Cash exceeds market cap by over $700K.
You are being paid to own the operating business.
And that operating business trades at 7.7x earnings, on a company that has just returned to profitability and where the underlying economics suggest that profitability is likely to continue.
Why It’s Cheap
A few things conspired to keep this stock invisible.
The company went dark and stopped reporting entirely. And even when it came back in 2022, most investors are not paying attention to anything labeled “Caveat Emptor” on the OTC markets.
Then it reported four straight years of accounting losses.
And the business is genuinely boring and doesn’t get any analyst coverage.
The Thesis
Angstrom Technologies is a small, profitable specialty chemicals business that the investment community has entirely overlooked.
The stock trades at a significant discount to its cash alone, with the operating business essentially being priced at zero or negative value.
After five years of compressed margins, the company has returned to what looks like structural profitability, and is buying back shares.
And if gross margins stay in the 55-60% range, which the recent price index data supports, the business generates meaningful earnings even on flat revenue.
Additionally, advertising spending nearly doubled in FY2025 ($97K vs $43K the year before). The buyback program is also accelerating. Every share retired at 50 cents on the dollar of NCAV creates value for shareholders.
If profitability stabilizes or grows even modestly, earnings per share will compound quickly.
And if the market ever recognizes this for what it is, a debt-free business trading below its cash balance with growing profits, the re-rating could be significant.
The Bear Case
Revenue has been declining. It peaked at $5.83 million in FY2019 and came in at $4.20 million in FY2025. If the top line keeps shrinking, the margin recovery will not be enough to save earnings.
Three customers represent 65% of revenue. One vendor represents 82% of all purchases. If any of those relationships change, the impact is immediate and large.
FY2025 margins might not hold. If raw material costs rise again, margins could creep back down. We will not know until the next annual report.
The stock is also illiquid. Trading volume is thin. Spreads can be wide. And getting in or out may not be easy.
Lastly, the CEO owns less than 1% of the company. That limits the alignment somewhat.
Speaking of ownership:
Ownership Structure
The company filed a Management Certification with OTC Markets in January 2026. Here is what we know about insider ownership:
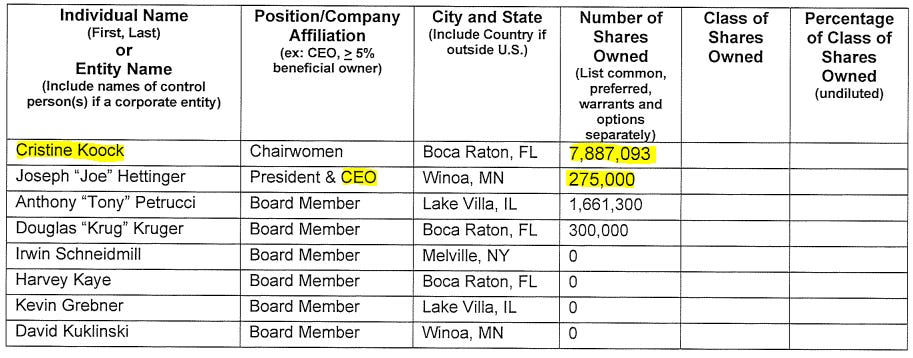
The Chairwoman, Cristine Koock, is by far the largest insider holder with 7.9 million shares, or 22% of the ~35 million shares outstanding. This gives her substantial influence over corporate decisions and aligns her interest significantly with that of public shareholders.
The CEO, Joseph Hettinger, holds only 275,000 shares (~0.8%), which is comparatively low.
Four of eight board members hold zero shares. Combined with the CEO’s low ownership, this suggests the board is not heavily equity-aligned overall, with the exception of the Chairwoman.
That’s worth keeping in mind. I would rather see more skin in the game at the top.
Final Thoughts
Let me try to summarize what we actually have here.
A specialty chemicals manufacturer with a 55–60% gross margin profile, zero debt, and $2.74 million in cash. Trading at a market cap of $2.03 million.
The balance sheet is what makes this stand out. Full stop.
Management is buying back shares. Slowly, but consistently, and at an accelerating pace. At these prices, that is about as rational a use of cash as you can find.
The past four years looked terrible on paper. But they were the result of price movements that squeezed Angstrom’s margins. Those same price movements are now running in Angstrom’s favor.
That margin story is also the most uncertain part of this thesis. I would have liked more to work with here. Some management commentary, or some older reports. Neither exists.
The theory I built around the price indices is what makes the most sense to me given the data available. But I cannot say with certainty that it is right.
What I can say is that the balance sheet situation makes this idea extremely attractive regardless. It provides a real margin of safety. And frankly, if the information had been easier to find, the opportunity probably would not exist in the first place.
I am reasonably confident in the thesis. But reasonably confident is not the same as certain. So I would not suggest making this a large position in any portfolio.
If anyone has access to older reports on this company or any additional information and wants to share it, feel free to reach out via X.
Disclaimer: The information provided in this newsletter is intended for informational and educational purposes only. It does not constitute financial, investment, legal, or tax advice. All analyses, opinions, and interpretations reflect my personal views at the time of publication and are provided without reference to the individual circumstances or objectives of any reader. All analyses, information, and opinions have been prepared with great care. Nevertheless, no guarantee can be given as to the accuracy, completeness, or timeliness of the information provided. Use of the content is at the user’s own risk. Investing in securities involves risk, including the possible loss of capital. Readers should conduct their own research and, if necessary, consult a qualified professional before making investment decisions.