
A Wonderful Business at a Wonderful Price
Aggressive Share Buybacks. 20% Free Cash Flow Yield. 5x EV/EBIT.

Key Metrics:
20% FCF Yield
5x EV/EBIT
Aggressive Share Buybacks
No Debt
Warren Buffett once said:
“I try to invest in businesses that are so wonderful that an idiot can run them.”
I’ve always liked that idea.
But do you know what I like even more?
A wonderful business at a wonderful price.
And that’s exactly what today’s stock is.
It is not exciting. It is not fast growing. And it will never dominate headlines. Instead, it quietly prints cash, year after year.
It consistently produces free cash flow, earns high returns on capital, and has used that cash to aggressively buy back its own shares.
Since 1999, the company has reduced its share count by more than 80%, including 34% since 2022 alone.
Earnings per share have grown at a 10-year CAGR of 15%.
And yet, despite all of this, the stock still trades at an extremely attractive valuation of 5x EV/EBIT and a free cash flow yield of 20%.
Let’s take a closer look.
Colefax Group PLC
Ticker: CFX Market cap: £49.3m
Colefax Group is a London-based designer and distributor of luxury furnishing fabrics, wallpapers, and interior design services. The company operates at the very top end of the market and sells primarily to interior designers and specialist retailers across more than 50 countries.
What makes Colefax unusual is not growth at any cost, but consistency. For decades, the business has maintained stable margins, generated steady cash flow, and used that cash to aggressively buy back its own shares. Since 1999 alone, the share count has been reduced by more than 80%.
The roots of Colefax go back to the early 1930s.
The business was founded in 1933 by Lady Sibyl Colefax, a British socialite who turned her natural talent for interior decoration into a profession after losing much of her wealth in the Wall Street Crash of 1929.
She began by decorating homes for friends within her social circle, quickly building a reputation among the UK’s wealthiest families.
In 1938, she partnered with John Fowler, who would later become one of the most influential English interior designers of the 20th century, and the firm became known as Sibyl Colefax & Fowler.
In 1948, the company was acquired by Nancy Lancaster, another well-connected figure who played a central role in shaping Colefax’s identity. Lancaster helped popularize what later became known as the “English Country House” or “English Style”.
Under her ownership, the firm expanded its reach beyond the UK, particularly into the United States, and further cemented its status at the very top of the interior design world.
During the 1960s and 1970s, Colefax entered its first phase of structured growth. The decorating teams expanded, and management began to look for ways to diversify the business beyond bespoke interior projects. This led to the launch of branded fabric and wallpaper collections.
In 1973, Colefax opened its first retail shop selling off-the-shelf fabrics, followed by a wallpaper collection in 1982. This marked an important shift. The company was no longer just a decorating firm for a small elite but had begun to turn its design expertise into scalable products.
A major turning point came in 1986, when David Green bought an initial stake in the business and took over leadership.
Green, who is still CEO today, initially pursued growth through acquisitions.
Throughout the late 1980s and 1990s, Colefax acquired several premium fabric and wallpaper brands, including Cowtan and Tout, Larsen, Jane Churchill, and Manuel Canovas, building a portfolio of five distinct luxury brands alongside the original Colefax & Fowler.
Within a decade, the group had completed five acquisitions and became publicly listed, first on the main market of the London Stock Exchange and later on AIM.
By the late 1990s, however, Green made a decisive shift in strategy. Having completed the acquisition phase by 1998, he concluded that further deals offered diminishing returns.
Instead of paying high prices for external brands, he redirected the company toward organic growth and capital returns. From that point on, excess cash was increasingly used to buy back Colefax’s own shares.
Today, Colefax is one of the two or three largest players in the true luxury fabric and wallpaper segment. While its global market share is only around 5%, its position in core markets is much stronger.
In the UK premium segment, Colefax holds well over 15% share, with a similar presence in the US. In both countries, the top five players typically account for 30% to 50% of sales, with the remainder spread across many small, often family-run firms.
Publicly listed peers are rare. Sanderson Design Group in the UK and Embellence Group in Sweden are the closest comparables. Successful new entrants at the very high end of the market have been extremely rare over the past 20 years.
The business today is split into two divisions.
The smaller one is the Decorating Division, operating under the historic name Sibyl Colefax & John Fowler. This is the original interior design business and accounts for roughly 10 to 15% of group revenue, primarily in the UK.
It undertakes a limited number of high-value projects for private clients. Revenues and profits are lumpy, depending on the timing of project completions. EBIT margins are modest, around 5%, and the division is not a meaningful growth driver, though it remains important for brand heritage.
The core of Colefax is the Product Division. It generates close to 90% of group sales and achieves higher EBIT margins of 8% to 12%. The division focuses on the design and distribution of luxury furnishing fabrics and wallpapers across five brands: Colefax & Fowler, Cowtan & Tout, Jane Churchill, Larsen, and Manuel Canovas.
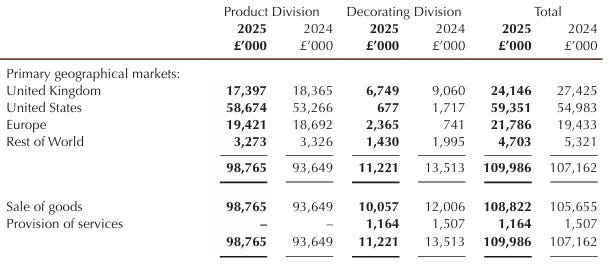
Each brand has its own design language and price point, serving different segments of the luxury market. This portfolio structure provides a degree of diversification.
The Product Division also includes Kingcome Sofas, a small UK-based luxury sofa business that represents around 3% of group revenue. Sofas are made on a made-to-order basis and are funded by customer deposits.
Apart from this, Colefax does not manufacture its products. Fabrics and wallpapers are sourced from more than 120 specialist suppliers across the UK, Europe, and India.
This asset-light model keeps capital needs low and has contributed to stable gross margins over many years.
Geographically, the US is the most important market, accounting for just over half of total group revenue and ~64% of Product Division sales.
Almost every sale involves an interior designer, and Colefax works with roughly 30,000 designers worldwide.
Pricing power is strong, and cost inflation has historically been passed on quickly.
Income Statement
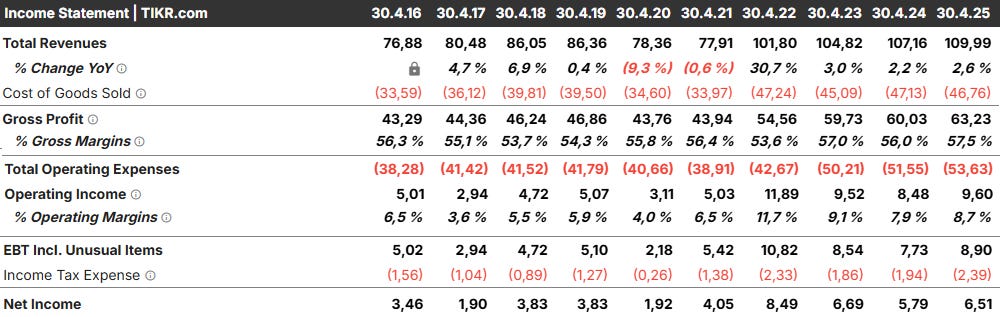
One of the most striking features of Colefax’s income statement is its long-term consistency.
Since the late 1990s, gross margins have remained within a remarkably narrow range, typically between 53% and 57%. Operating margins have fluctuated more, moving between 3% and 12%.
Revenue growth has been modest but persistent. Since 1998, group revenues have grown at an average growth rate of ~ 3% per year. Over the past decade, growth has been somewhat stronger, with revenues increasing from £77 million to £110 million, providing an average annual growth rate of about 4%.
In FY2022, Colefax benefited from an unusually favorable post-pandemic environment. Lockdowns and travel restrictions led to a surge in housing transactions and home-related spending, particularly at the high end of the market.
As a result, group revenues increased by 30.7% in a single year. Importantly, rather than giving back those gains, Colefax managed to hold on to the higher revenue base and even grow sales modestly in the years that followed.
I like that FY2022 was not just a one-off spike, but a step-change in the scale of the business.
Additionally, Colefax has not posted a loss-making year for at least the past 25 years.
The business is not immune to economic cycles, and earnings do dip from time to time, but they have never turned negative.
This resilience is closely tied to the nature of its customer base. By catering primarily to high-net-worth clients and operating at the very top end of the market, Colefax is less exposed to short-term swings in discretionary spending.
While revenue growth has been steady rather than spectacular, shareholder returns have been meaningfully enhanced by capital allocation.
Since 1999, Colefax has returned £62.7 million to shareholders through buybacks and reduced the share count by more than 80%, from 28.5 million shares to just over 5.2 million today.
Following the post-COVID recovery, Colefax resumed aggressive share buybacks and reinstated a small dividend. Since 2022 alone, the company has reduced its share count by 2,476,585 shares, representing 34.0% of the shares outstanding at the start of the period. This includes two large tender offers, most recently completed in October 2025.
Dividends remain small relative to buybacks. In FY2025 the company spent £2.4 million on share repurchases and only £0.355 million on dividends, returning a total of 5.9p per share.
This underscores how strongly management favours buybacks at current prices and signals that they view the stock as undervalued.
The impact on per-share results has been substantial. While net income grew from £3.46 million in 2016 to £6.51 million in 2025, a compound annual growth rate of approximately 7.3%, earnings per share increased from £0.32 to £1.08 over the same period.
This translates into an EPS CAGR of 14.5%, more than double the growth rate of total profits.
This also explains the long-term share price chart.
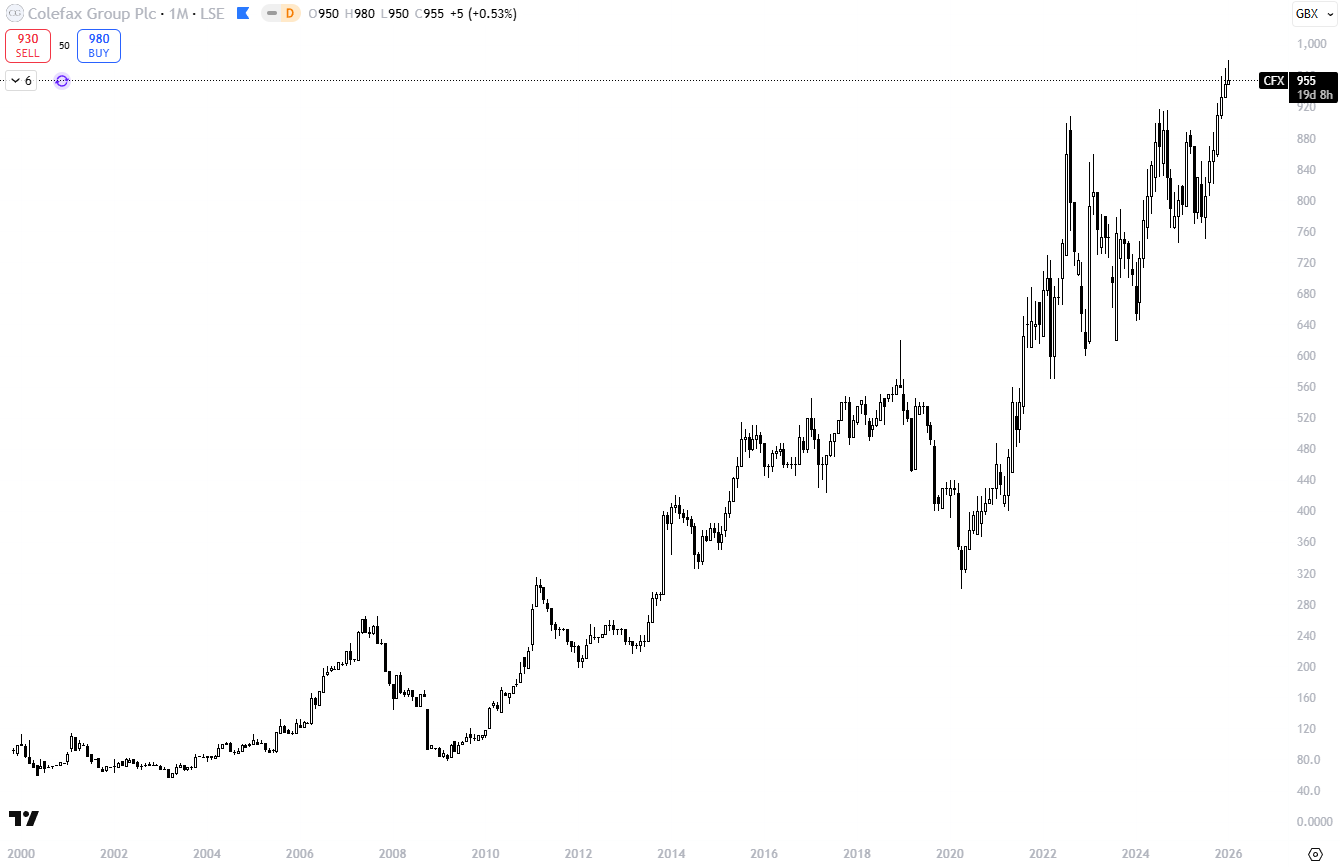
Since the end of the acquisition phase in 1998, Colefax has effectively been a share cannibal. As a result, over the past 20 years, the stock has become a ten-bagger, despite never being a high-growth business.
Finally, the growing importance of the US market deserves attention. Colefax now generates roughly half of its group revenue in the US, and US revenues have grown at a compound rate of 7.5% since 2020.
This is meaningfully higher than the group’s long-term average revenue growth. If this trend continues, the increasing weight of the US business could gradually lift the company’s overall growth rate over time, even without any change to the underlying business model.
Balance Sheet
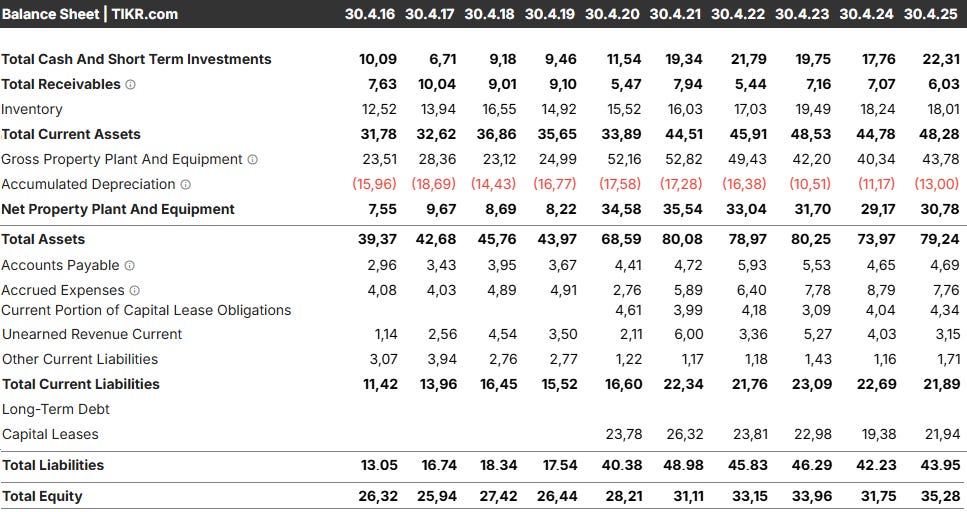
Colefax’s balance sheet is strong for a business of its size.
The company operates with no traditional debt and holds a significant cash balance of £22.3 million, despite years of aggressive share buybacks and regular capital returns. This provides a wide margin of safety and a high degree of financial flexibility.
The business model requires a relatively large inventory balance, with finished goods representing the largest component of working capital.
Beyond that, the main area that deserves closer attention is leases.
Colefax operates a global network of trade showrooms, particularly in the US and Europe. These showrooms are essential for serving interior designers and maintaining brand presence at the high end of the market.
Under IFRS 16, these leases are capitalized on the balance sheet as right-of-use assets with corresponding lease liabilities. As a result, Colefax reports lease liabilities of £22 million, including £5.1 million classified as current.
At first glance, this can make the balance sheet look more leveraged than it really is. Economically, these lease obligations are not debt in the traditional sense. They are recurring operating costs, equivalent to rent paid for showrooms that are critical to running the business.
Treating them as financial debt risks overstating leverage and double-counting costs when valuing the company.
This accounting treatment also distorts the cash flow statement.
Under IFRS 16, lease payments are split between depreciation and interest, while the actual cash payments are recorded under financing activities.
As a result, reported operating cash flow is inflated and no longer reflects the true cash generated by the business after paying for premises.
Management explicitly acknowledges this and states that operating cash flow is no longer a meaningful performance measure on its own.
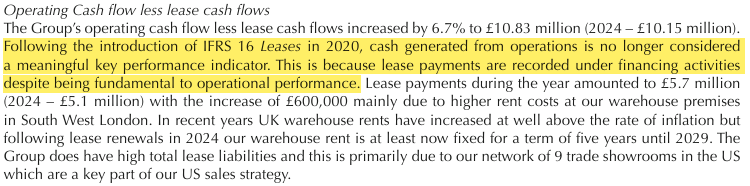
Instead, it focuses on operating cash flow less lease payments.
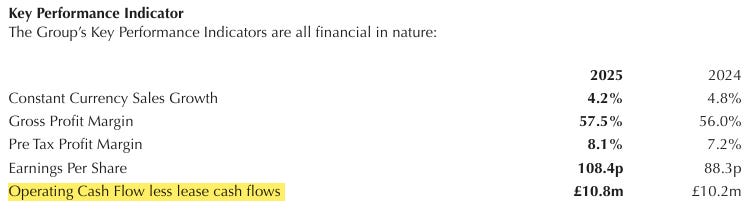
This adjusted figure provides a much clearer picture of underlying cash generation.
In the most recent year, operating cash flow less lease payments amounted to £10.8 million, while lease payments themselves were around £5.7 million. These lease costs are recurring and unavoidable, but they are comfortably covered by operating cash flow.
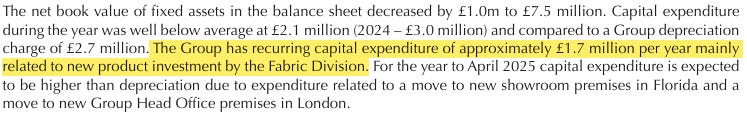
Looking at capital expenditure, reported capex has been somewhat elevated in recent years due to a handful of non-recurring investments. In the most recent year, capital expenditure was £2.07 million, compared with £2.99 million the year before. Over the past decade, average capex has been £2.68 million per year.
However, recurring maintenance capex is meaningfully lower. On an ongoing basis, around £1.7 million per year is required, primarily for new product development within the Fabric Division.
Using a conservative approach and deducting the long-term average capex of £2.7 million from operating cash flow less leases, Colefax generates around £8.1 million in adjusted free cash flow.
Using a more realistic maintenance capex assumption, adjusted free cash flow is closer to £9.0 million.
Either way, the business produces substantial, repeatable cash flows relative to its size, which explains both its strong net cash position and the company’s ability to consistently return capital to shareholders.
Valuation
Colefax is not a business that requires aggressive assumptions to look attractive.
Even on a standard, unadjusted basis, the stock already trades at a valuation that implies very modest expectations.
Using a conventional approach that treats IFRS-16 lease liabilities as debt, Colefax currently trades at 5.6x EV/EBIT.
On a cash flow basis, the picture looks similar. Based on adjusted free cash flow of £8.1m to £9.0m, the stock offers a 16.4% to 18.2% free cash flow yield. That is already low for a business with stable margins, no financial leverage, and a long record of capital returns.
That said, the leases make valuation slightly more complicated.
The present value of future lease payments is capitalized on the balance sheet and treated like debt. Economically, however, these leases are operating costs. They are no different from rent and are required to generate revenue.
For this reason, it is useful to look at an adjusted valuation that treats leases as operating expenses rather than financing.
Currently Colefax has net cash of £22.3m. With a current market capitalisation of £49.3m, this implies an adjusted enterprise value of £27m.
For FY25, the company reported EBIT of £9.6m, which already includes all operating costs, including showroom rents and other lease expenses.
Using this adjusted EV, Colefax trades at just 2.8x EV/EBIT.
Even if we take a more cautious view and normalise EBIT to £7.5–8.0m, to reflect a softer near-term environment or tariff-related noise in the US, the multiple only rises to around 3.4–3.6x.
The same picture emerges when looking at cash flow. Using adjusted free cash flow of approximately £9m against an adjusted enterprise value of £27m results in a free cash flow yield of roughly 33%.
It is also worth highlighting the contrast with peers.
Sanderson Design Group, Colefax’s closest UK peer, trades at 16.5x EV/EBIT, despite weaker margins and a more challenged end market.
Embellence Group in Sweden trades at 10.9x EV/EBIT.
Both operate in similar industries, yet neither matches Colefax’s balance sheet strength or long-term share buyback record.
In that context, I find the current valuation extremely attractive for a durable, asset-light, and shareholder-focused share cannibal like Colefax.
Risks
Colefax is not without risks. The two most relevant ones are exposure to international trade policy, particularly tariffs, and the question of management succession.
(1) Tariff and Trade Risks
Colefax sources a large share of its fabrics and wallpapers from Europe and sells a significant portion of its products into the United States. This makes the group exposed to changes in international trade policy.
A look at history provides some useful context. Following Brexit, new import duties into the EU reduced the Product Division’s profitability by more than £1m.
While this was a meaningful headwind, Colefax was able to absorb these costs over time. Gross margins remained resilient, and the business continued to generate strong cash flows.
This suggests that, at least partially, higher costs can be passed on to customers without materially damaging demand.
That said, the risk remains. Any new tariffs on goods imported into the US could increase the landed cost of Colefax’s products.
At the same time, there are mitigating factors. Colefax operates at the very high end of the market, where purchasing decisions are driven more by brand, design, and reputation than by small price differences.
(2) Aging Management and Succession Risk
The second major risk relates to management and succession. Colefax is led by an experienced but aging leadership team, most notably CEO David Green, who is now 79 years old.
David has been instrumental in shaping the company’s strategy over the past decades, particularly the shift away from acquisitions toward aggressive share buybacks and disciplined capital allocation.
This creates a key-person risk. A change in leadership could lead to a change in strategic direction, especially regarding capital returns and growth priorities.
One potential successor is Tim Green, David’s son, who has been with Colefax for several years in a senior commercial role and was recently appointed to the board. Prior to joining Colefax, Tim was CEO of Tangent Communications Plc, which was successfully taken private by private equity.
Tim currently owns around 4% of Colefax, with an additional 2% held by his children.
There are several possible outcomes.
David could eventually sell the business, likely at a materially higher valuation than today.
Alternatively, he could step aside and hand over control to a successor. In that case, strategy becomes the key question. A new CEO could continue the current buyback-focused approach, or pivot back toward acquisitions and growth initiatives, which would introduce a different set of risks.
The fact that Tim previously sold his own company is noteworthy and leaves open the possibility that, if he becomes successor, he might pursue a similar path at Colefax.
Final Thoughts
Colefax has made good use of an unusually strong FY22. Instead of chasing growth or stretching the balance sheet, the company consolidated its higher revenue base, invested in the business, and returned excess cash to shareholders through dividends and share buybacks.
Once leasing costs are treated as what they truly are, operating expenses, Colefax emerges as a steady producer of free cash flow. This is true even in a more challenging environment marked by political uncertainty around trade.
The business is not immune to these pressures, but its positioning at the very high end of the market provides a strong degree of resilience.
There are risks, particularly around tariffs and long-term succession.
Still, at the current valuation, there appears to be a meaningful margin of safety for investors with a long-term horizon.
Colefax is unlikely to become a ten-bagger from here. But as a durable, cash-generative, and shareholder-focused business, it has the potential to be a quiet, steady, and deliberately boring compounder in any portfolio.
Disclaimer: This content is provided for informational and educational purposes only and does not constitute financial, investment, legal, or tax advice. I am not a registered investment advisor or broker. Nothing written here should be relied upon to make investment decisions. Always conduct your own research and consult with a qualified financial advisor before investing. I may or may not hold positions in the securities discussed, and that may change without notice. Any mention of a company, security, or strategy should not be interpreted as a recommendation to buy, sell, or hold. Investing in securities involves substantial risk, including the risk of total loss. Past performance does not guarantee future results. While I make reasonable efforts to ensure the accuracy of information, I cannot guarantee that the content is complete, accurate, or up to date. I accept no liability for any loss or damage arising from reliance on this content.
Is it traded on the London exchange under CFX? (I checked USA and see a CFXA - but looks like limited trading?) Thank you!