
A Structurally Declining Business with Serious Hidden Assets: A Case Study
Buffett’s 50% return on Sanborn Map

It was 1956, just two years after Buffett had started working for Ben Graham, when Graham suddenly retired, leaving Buffett without a job. By that time, Buffett had accumulated around $150,000, and he wasn’t looking for another employer.
What he wanted was a quiet base where he could read, think, and make investment decisions. He chose Omaha.
Alongside managing his own money, the 25-year-old Buffett opened a small investment partnership with six silent partners - mostly friends and family, including his Aunt Alice, who put in $35,000.
In total, Buffett raised $105,000. He put in only $100 himself.
He made every investment decision alone and never told his partners what he was buying. But he did write an annual letter summarizing performance and closed positions. His wife, Susie, would cook a chicken dinner for the annual meeting.
His results were so strong that new investors arrived quickly. Many were former Graham clients looking for a new home for their capital.
Over the next few years, Buffett launched more partnerships and eventually consolidated them into one in 1962. At the time of the investment we’re looking at today, he was running seven.
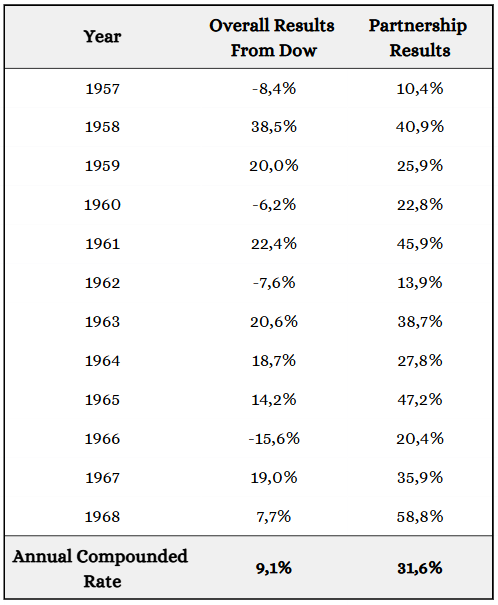
This image shows the performance of the Buffett partnerships from 1957 to 1968. During that period, Buffett didn’t have a single down year. On average, he earned triple the annual return of the Dow, before fees.
This case study is about one of the investments he made during those partnership years.
The story begins in November 1958. At that point, Buffett was managing about $1 million.
By then, the stock market had spent nearly a decade trending pretty much straight upward. Prices had been rising much faster than the underlying earnings, and P/E ratios had climbed with them.
It was no longer a time when Buffett could simply flip through Moody’s Manual and find great companies selling for 2x earnings.
He couldn’t just buy a stock and wait for the cigar butt to light anymore. He had to work much harder and be far more active in the companies he invested in to continue generating high returns for his partners. These projects sometimes took months or even years to fully play out.
The first major project of this kind was Sanborn Map.
Sanborn Map
Sanborn Map Co. was a small New York-based company that produced extremely detailed maps for cities across the United States.
These maps showed things like power mains, water mains, engineering layouts, and even emergency staircases inside buildings. Sanborn sold these map volumes primarily to insurance companies that depended on them to assess fire risk.
This is what one of their maps of Manhattan, New York, looked like:
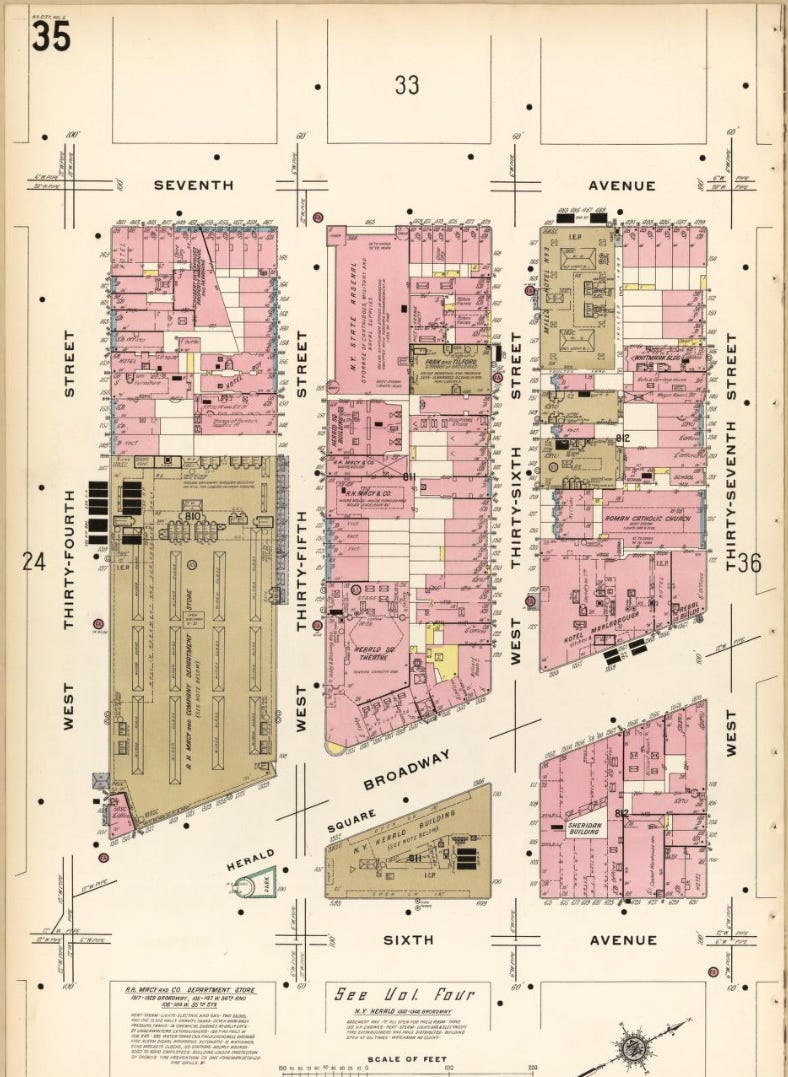
Each commercial product was essentially a massive book, a collection of dozens of maps, weighing about fifty pounds.
Rise to Market Leader
From an investor’s perspective, the business was highly attractive.
Sanborn’s maps had the advantage of scale. Once the company had completed the very expensive process of mapping a city, the same maps could be sold to multiple insurance companies for years, with almost no additional operating cost.
As time went on, margins expanded and profits grew.
The structure of the industry also created a natural barrier to entry. If a competitor entered the same city, for example, they would have to split the revenue from that market. However, the smaller amount of revenue in a divided market would no longer justify the large upfront investment required. Therefore, once Sanborn had mapped a city, no second competitor would enter the market.
The company also invested heavily in training its staff to produce high-quality maps, and they pushed expansion aggressively. By the 1920s, Sanborn had become the dominant player in the industry, and it remained so for decades.
Decline
In the 1950s, however, a new technology emerged that began to erode Sanborn’s moat.
Insurance companies started adopting a method called “carding.” Instead of relying on physical fire maps, they began using algorithmic risk models based on financial and structural data. These models gradually replaced the need for detailed building maps.
Buffett described the impact in his 1960 partnership letter:
„In the early 1950’s a competitive method of under-writing known as “carding” made inroads on Sanborn’s business and after-tax profits of the map business fell from an average annual level of over $500,000 in the late 1930’s to $100,000 in 1958 and 1959. Considering the upward bias in the economy during this period, this amounted to an almost complete elimination of what had been sizable, stable earning power.“
The Investment
By 1958, when Buffett began buying Sanborn, profit margins had already been falling for several years, and the share price dropped to ~$45 compared to the $110 it had traded at in 1938. At that price, the company was valued at roughly $4.7M ($45 × 105,000 shares).
At first glance, the business must have looked fundamentally weak to Buffett. It was facing a clear structural decline, and operating income had collapsed.
But it was far from a dying company.
Sanborn still generated $2 million in annual sales and remained profitable, even if operating income had fallen from $500,000 a year to about $100,000.
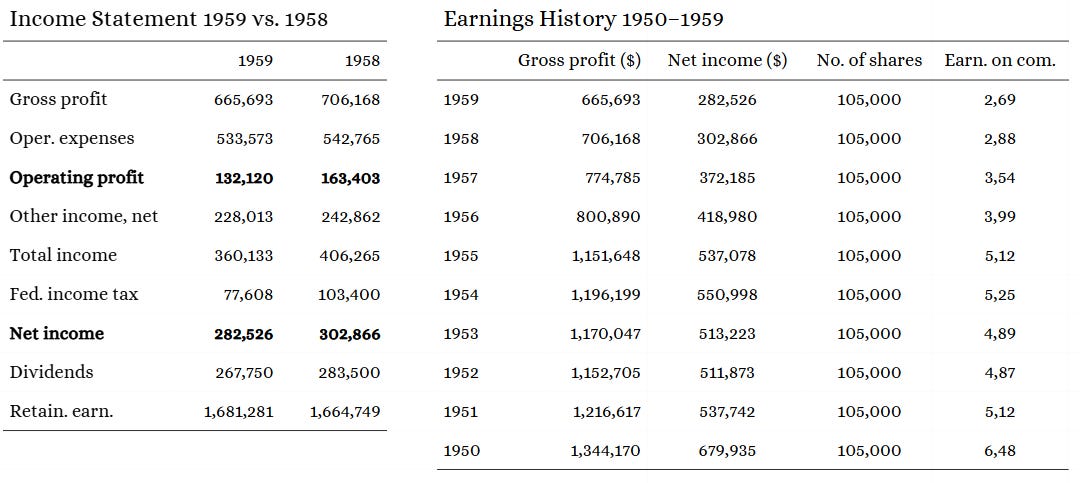
(Data from the 1960 Moody’s Industrial Manual)
With $2 million in revenue and $163,403 in operating income, Sanborn was trading at 2.35x sales and 28.8x 1958 earnings.
For a declining business, this would not have looked cheap on an earnings basis alone.
In fact, you would have had to assume that earnings would rebound all the way back to their 1938 level of $500,000 for the stock to trade at an acceptable P/E of 10. And even then, I doubt you’d want to be invested in a structurally declining business.
But there was something else that caught Buffett’s attention.
The most interesting part of Sanborn Maps had nothing to do with maps at all. It was the balance sheet.
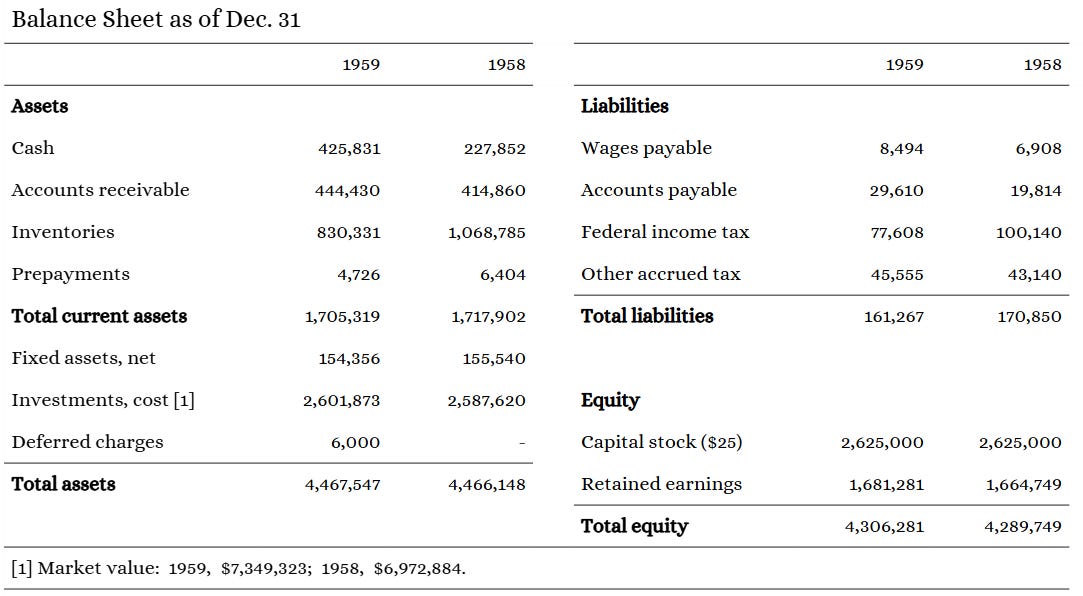
Over decades of strong profitability, Sanborn had built a sizeable investment portfolio of bonds and blue-chip stocks. In total they had originally invested $2.6 million (“Investments, cost” on the balance sheet), and thanks to the powerful post-war bull market, the portfolio had grown to $7 million.
That portfolio alone produced more than $200,000 in investment income (“Other income”), which was twice the operating income of the map business.
But more importantly: The investment portfolio was worth more than the entire market cap of the company.
With the stock trading at $45 and the portfolio worth $65 per share, investors were effectively paying $0.70 on the dollar for the portfolio, and getting the operating business for free.
Buffett highlighted this absurd mispricing in his 1960 partnership letter:
„In 1938 when the Dow-Jones Industrial Average was in the 100-120 range, Sanborn sold at $110 per share. In 1958 with the Average in the 550 area, Sanborn sold at $45 per share. Yet during that same period the value of the Sanborn investment portfolio increased from about $20 per share to $65 per share. This means, in effect, that the buyer of Sanborn stock in 1938 was placing a positive valuation of $90 per share on the map business ($110 less the $20 value of the investments unrelated to the map business) in a year of depressed business and stock market conditions. In the tremendously more vigorous climate of 1958 the same map business was evaluated at a minus $20 with the buyer of the stock unwilling to pay more than 70 cents on the dollar for the investment portfolio with the map business thrown in for nothing.“
The Buying Process
Warren was very convinced Sanborn would produce excellent results.
In his 1958 letter he wrote:
„In this particular holding we are virtually assured of a performance better than that of the Dow Jones for the period we hold it.“
So, in typical Warren Buffett fashion, he bet heavily on the situation.
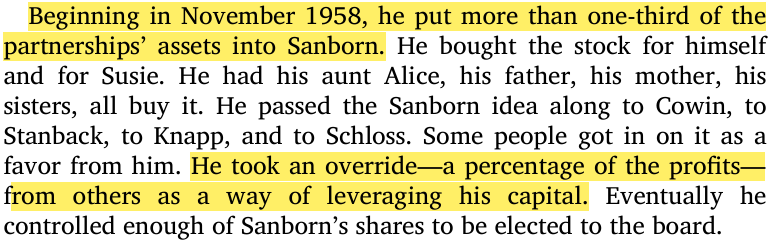
Starting in November 1958, he put more than one-third of his $1 million partnership assets into Sanborn Map.
On top of that, he bought shares for himself and for his wife, Susie.
But he didn’t stop there.
He encouraged various friends and relatives to buy Sanborn as well, including his aunt Alice, his father, his mother, and his sisters. He also shared the idea with colleagues from the Ben Graham School, including Walter Schloss.
For the privilege of sharing the idea and for doing the activism work required to unlock the value, Buffett took what is known as an override; essentially a small percentage of their profits. It was his way of leveraging his capital by betting on himself and capturing a share of the upside generated through his effort.
After this first wave of buying, Buffett controlled enough shares to secure a seat on Sanborn’s board.
He flew to New York for a ten-day business trip, covering different things, like investor meetings, research visits, and, on one of those days, his very first Sanborn board meeting.
(The Snowball, p. 278)
First Board Meeting
When Buffett walked into his first Sanborn board meeting, it was nothing like what he had expected.
He later described it as an old boys’ club, not a board focused on creating shareholder value.
Most board members were representatives of insurance companies, Sanborn’s biggest customers, who had a clear incentive to keep profits from rising too far.
There was also zero insider ownership on the board. Of the nine members from the insurance companies, the combined holdings amounted to just 46 shares. They had basically been content to sit on the board, collect their salaries, and maintain the status quo.
During the meeting, Buffett proposed a simple idea to the board. He suggested that they split the operating map business from the investment portfolio to make it clearer to investors where the value is.
He believed this would immediately unlock significant shareholder value.
But the board resisted. Strongly.
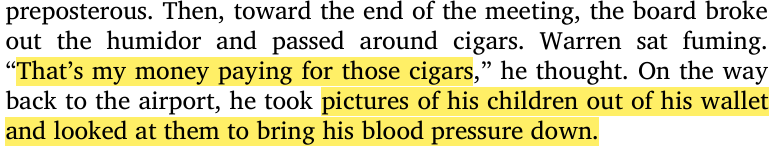
The meeting quickly deteriorated into open dismissal. At one point, the directors literally pulled out cigars and started smoking.
Buffett was sitting there thinking “It’s my money they’re using to pay for those cigars,” and felt his anger rising.
It got to the point where he had to take out photos of his children from his wallet just to calm himself down.
(The Snowball, p. 279)
Buying Even More
Buffett left that first board meeting very frustrated.
So he went back into the open market and bought even more shares.
By this time, his reputation in the investment world was growing. New investors were flowing into his partnership, giving him additional capital to work with. This allowed him to accumulate an even larger position in Sanborn.
His final partnership holdings reached 24,000 shares, or 22.8% of Sanborn. His associates owned another ~21%. Together, they controlled well over 40% of the company.
Buffett now had effective control of the business and eagerly wanted to take the company away from Sanborn’s undeserving board.
So he went back for round two.
Second Board Meeting
At the second board meeting, Buffett presented the same proposal again; split the map business from the investment portfolio.
But even with all the additional ownership he had accumulated, the board still rejected his plan.
And to annoy him even further, they once again brought out the box of cigars.
Three days later, an extremely annoyed Buffett contacted the directors again and threatened to hold a special meeting in which he would take control of the company, if they did not agree to his plan.
Finally, more than a year after Buffett first began buying Sanborn stock, the pressure finally worked and the board made an offer to shareholders.
Outcome
It was structured in a fairly interesting way. Shareholders could exchange their shares for a portion of the investment portfolio.
By going through this exchange, shareholders could trade their shares, which were trading at $45 for an investment portfolio worth about $65. They could then immediately sell that portfolio and capture the spread between those numbers.
It worked out well for all the shareholders, even for those who did not take the deal. About 72% of the Sanborn shares were tendered into that transaction. Shareholders who didn’t participate ended up owning the remaining operating map business, which now had significantly fewer shares outstanding.
In the end, through persistence and sheer force, Buffett’s partnerships earned around a 50% profit.
Buffett summarized the outcome in his 1960 partnership letter:
„About 72% of the Sanborn stock, involving 50% of the 1,600 stockholders, was exchanged for portfolio securities at fair value. The map business was left with over $1.25 million in government and municipal bonds as a reserve fund, and a potential corporate capital gains tax of over $1 million was eliminated. The remaining stockholders were left with a slightly improved asset value, substantially higher earnings per share, and an increased dividend rate.“
Learnings
Investors like Carl Icahn and Bill Ackman have made activist investing famous.
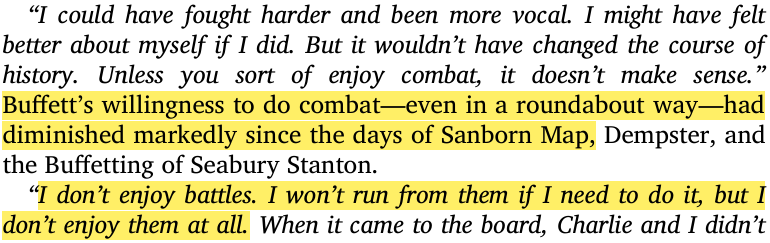
What’s interesting is that long before them, back in the 1950s, Buffett also stepped into activism when the situation demanded it.
But it’s important to emphasize that Buffett was not necessarily a fan of activism. He did it only when it was necessary to protect or unlock value, not because he enjoyed the fight.
As highlighted in The Snowball:
(The Snowball, p. 610)
Lastly, I would like to mention the four key sources that I used to put together this case study:
The Snowball, by Alice Schroeder
Inside the Investments of Warren Buffett: Twenty Cases, by Yefei Lu
The Deals of Warren Buffett: The First $100M, by Glen Arnold
The Buffett Partnership Letters (especially the 1960 letter)
I hope you enjoyed it.
Noel from Deep Value Insights
Disclaimer: This content is provided for informational and educational purposes only and does not constitute financial, investment, legal, or tax advice. I am not a registered investment advisor or broker. Nothing written here should be relied upon to make investment decisions. Always conduct your own research and consult with a qualified financial advisor before investing. I may or may not hold positions in the securities discussed, and that may change without notice. Any mention of a company, security, or strategy should not be interpreted as a recommendation to buy, sell, or hold. Investing in securities involves substantial risk, including the risk of total loss. Past performance does not guarantee future results. While I make reasonable efforts to ensure the accuracy of information, I cannot guarantee that the content is complete, accurate, or up to date. I accept no liability for any loss or damage arising from reliance on this content.
Warren's persistence, which would help to forge the foundation of Berkshire Hathaway, is certainly evident in your writing. Thank you for sharing this (true) story.
Great breakdown
He was comfortable putting over 33% of the entire partnership into this single stock. It shows that even back then, he understood that when the odds are heavily in your favor, you bet big, a distinct departure from Ben Graham.
If he had continued with these 'buy, fix, and sell' liquidation plays, Berkshire never would have become the $1 Trillion fortress with $300B+ in cash that it is today. That strategy works beautifully for small sums, but it simply does not scale to managing billions
To move the needle on that much capital, he had to shift toward 'Great Businesses at a Fair Price', compounders like Coca-Cola, Apple.
Thanks for sharing this history.